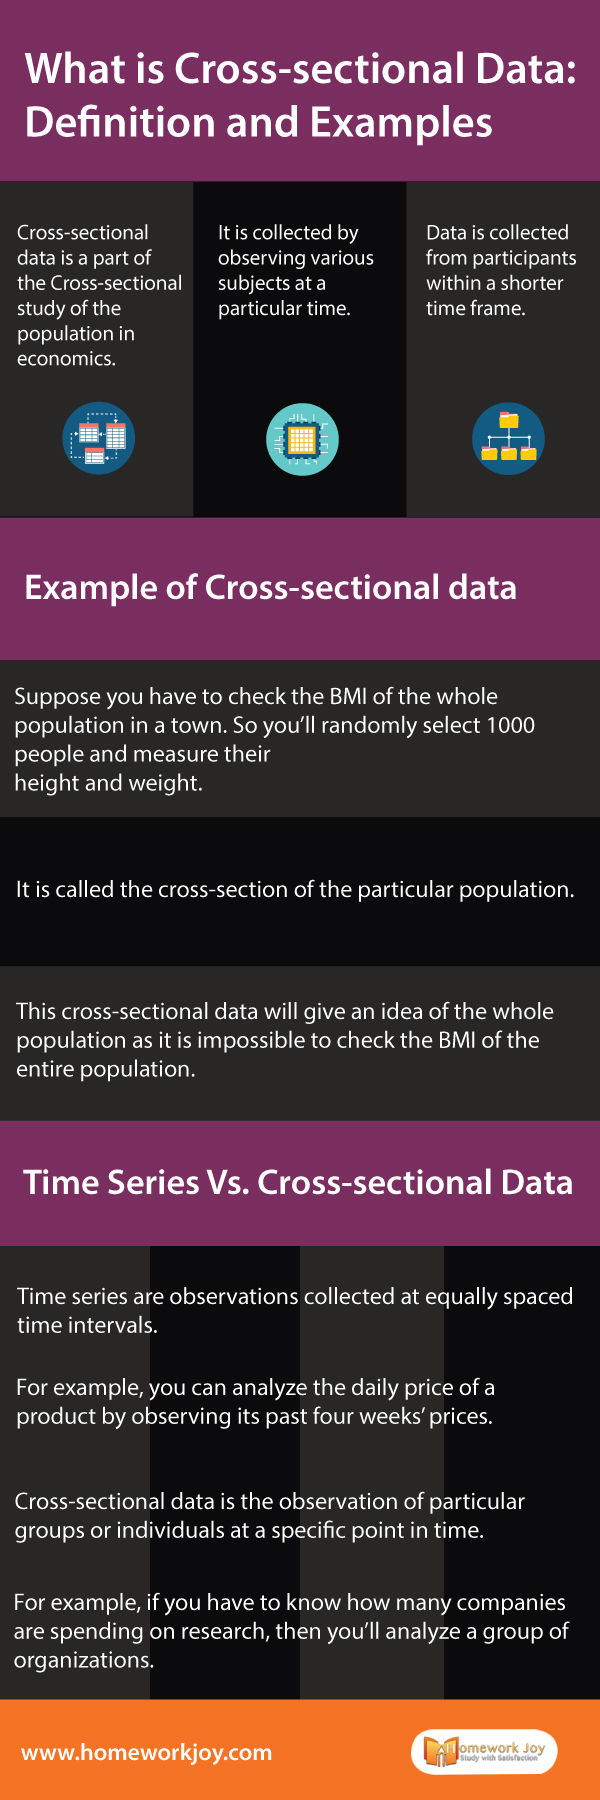
Cross-sectional data is a part of the Cross-sectional study of the population in economics. It is collected by observing various subjects at a particular time. Data is collected from participants within a shorter time frame.
Also, read some of our related posts:
Types of Sampling Methods | Simple Techniques and Examples
Difference Between Regression Vs. Correlation
Uses of Cross-sectional Data
It is mainly used in health care professionals to examine the relationship between disease and other variables’ interests. Thus it is useful in assessing the burden of disease or health needs of a population. Without cross-sectional data, planning, and allocation of health resources is impossible.
Example of Cross-sectional data
Suppose you have to check the BMI of the whole population in a town. So you’ll randomly select 1000 people and measure their height and weight.
It is called the cross-section of the particular population.
This cross-sectional data will give an idea of the whole population as it is impossible to check the BMI of the entire population.
Time Series Vs. Cross-sectional Data
Time series are observations collected at equally spaced time intervals.
For example, you can analyze the daily price of a product by observing its past four weeks’ prices.
Cross-sectional data is the observation of particular groups or individuals at a specific point in time.
For example, if you have to know how many companies are spending on research, then you’ll analyze a group of organizations.
Difference Between Cross-sectional Data and Panel Data
Although Panel Data is a combination of both cross-sectional and time-series data, there are some differences.
Panel data means the collection of observations for multiple subjects at multiples time intervals.
For example, to measure the maximum temperature, humidity, and wind of New York City, Boston, and San Fransico, we have to collect different data at different intervals.
Advantages and Disadvantages of Cross-sectional Data
Advantages
The advantages of cross-sectional data include the following points:
- Used to prove or disprove assumptions by collecting different data
- Captures specific data at a specific time
- Contains multiple variables at a particular time of data snapshot
- Cost-efficient to perform and doesn’t require a lot of time
DIsadvantages
The following are some disadvantages of cross-sectional data in statistics and economics.
- Doesn’t help in determining cause and effect
- Timing of the data is not guaranteed to be expressive
- Findings can be defective if there are conflicts of interest within the funding source.
- Not useful for analyzing behavior over a period to time
Thus these were some essential information about what cross-sectional data it. We hope you are now well aware of the topic. If you need more statistics assignment help, directly order it from us. Our experts are happy to serve you the best.
